Comparing 5 of the Top Analytics Platforms
There are more data analytics tools available than ever before, so check out our comparison of the major players.

Data collection is perhaps the defining innovation of our era. One of the most difficult problems, however, is effectively analyzing this data in order to make it actionable. Data without the proper analytics tools can actually harm your decision making processes, because when you don’t know what your data is telling you, you can use it to justify any decision.
Here at Vrrb, one of the main things that our clients need help with is collecting, analyzing, and executing decisions based on their datasets. To help kickstart this process, this week we’re going to analyze a few data analytics tools that can help you wrangle your data. From some of the big players in this space, to others that may not be on your radar yet, we’re here to help you figure out which data analytics tool is best for your business, along with the features you should be keeping an eye out for.
Google Analytics
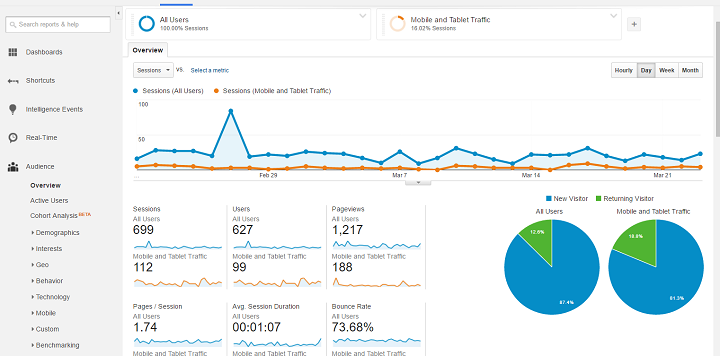
Easy to integrate with almost any website, Google Analytics allows you to access Google’s world-class toolbox, track and tag customers, and even generate in-depth SEO reports, all free of charge. Analytics is another tool in Google’s overflowing arsenal, and there’s even a Google Analytics Academy where you can learn more about the intricacies of the platform.
However, wrangling these intricacies isn’t always the breeze we’ve come to expect from other Google products like Maps, Search, or Gmail. Google Analytics is more complicated than it looks, requiring a deep understanding of the platform’s ‘language’ before you can glean any insights from all that data.
Additionally, while Google Analytics free version is more than adequate for most businesses, higher traffic websites that want to go premium will be set back a cool $150,000 for the premium version (Analytics 360). This includes custom user funnels, custom tables, advanced analytic tools, and BigQuery which ‘enables interactive analysis of up to trillions of rows of data, the joining of multiple data sources, advanced predictive modeling, natural language processing, machine-learning capabilities, and more.’ Complex enterprise organizations can benefit from this state-of-the-art data analysis capacity, bringing together all the Google tools your organization uses.
Hotjar
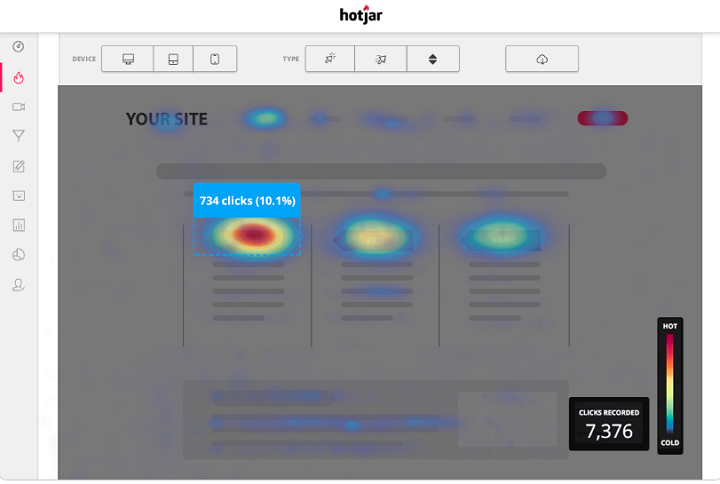
A major competitor of Google Analytics, Hotjar is a UX-optimized heat map for tracking and analyzing data. From allowing real replays of how actual users navigate your website, to figuring out where your sales funnel is leaking, Hotjar’s heatmap-driven dashboard helps you visualize data with ease. Another great aspect is the integration of user surveys, which makes obtaining, analyzing, and implementing user feedback extremely easy.
While heat maps are a powerful tool, there are still some drawbacks in their implementation. Sometimes, when a page has content below the fold, the heat map won’t capture this. New content is always immediately shown as ‘hotter’ than old content, which can make a task like sorting the popularity of blogs more difficult, as ‘new’ becomes synonymous with ‘popular.’ The number of website pages where its heat map tracking can be implemented is limited, and after that limit, you need to activate heat maps across all pages, which can take some time to implement. Finally, you still need to use Google Analytics in order to generate analytics reports, so consider this in regards to Hotjar’s price range of $99-389 for businesses, depending on web traffic.
Cloudflare
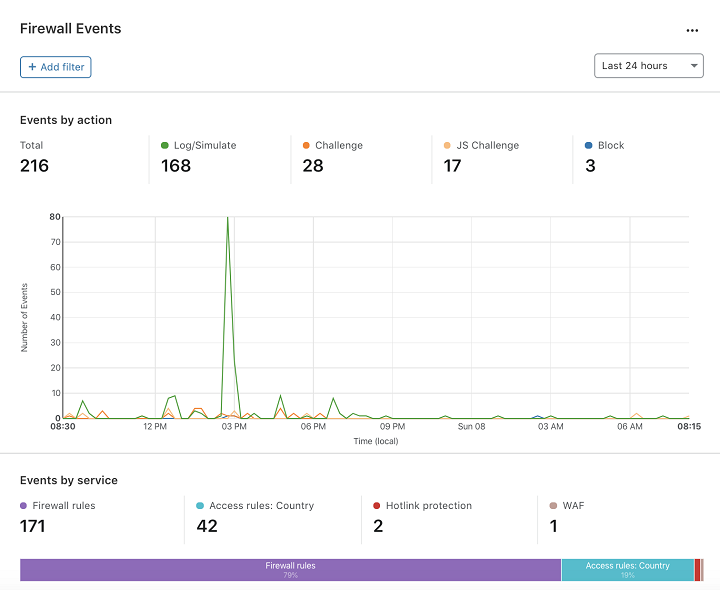
Already renowned in the web security market, Cloudflare is quickly becoming an analytics dynamo. Beyond optimizing the speed and security of your website, Cloudflare helps improve the web traffic you get, by allowing you to easily protect against outside attackers, and removing bad spam or bot traffic from your analytics metrics.
Since Cloudflare is still primarily a web security product, the analytics offerings, from threat and attack stats to daily traffic reports, are still limited compared to other, analytics-first competitors. Additionally, due to Cloudflare’s security basis, users can sometimes get blocked from accessing their own site if Cloudflare crashes, or perceives an outside attack is occurring.
Chartbeat
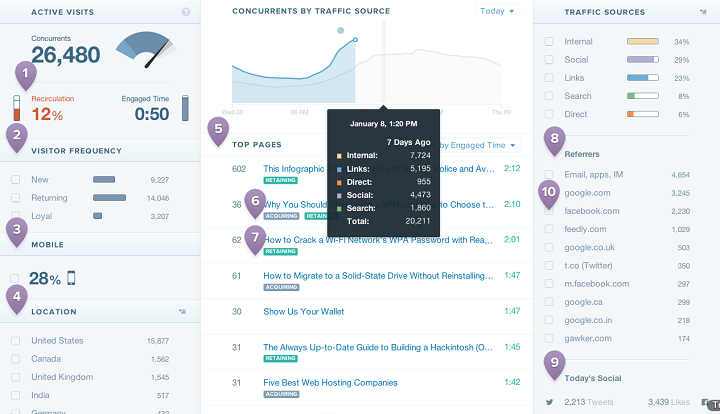
Offering in-depth dashboards, excellent optimization tools, and thorough reporting, Chartbeat helps customers optimize and monitor their content, to achieve higher engagement online. With A/B testing and live user statistics for real time feedback, companies can gauge and leverage authentic user behaviour to shape their website based on the way real people use it. Additionally, thanks to reporting that gives extremely specific traffic sources, Chartbeat gives users insight into their audience that they can act upon, to help drive business.
A common issue that users have with Chartbeat is pattern tracking difficulty. Pattern tracking involves going beyond real time data to log and analyze longer term trends. With data that only stretches back 30 days, Chartbeat doesn’t allow users to go back beyond a month, to compare their web traffic from similar time periods. Additionally, Chartbeat includes traffic from within the company in their web analytics, which can skew statistics and make an overall analytics data assessment slightly more tedious.
Kissmetrics
Kissmetrics offers advanced product and marketing analytics dashboards and reporting for both e-commerce and SaaS websites. Offering the ability to track desktop and mobile sessions for a single user at a granular level, and providing high-level detail on how different customizable user-defined funnels are performing, Kissmetrics offers users a range of analytics tools for both of its primary audiences. The tracking code can easily be installed by most users, even non-developers, which makes it possible to have Kissmetrics up and running quickly.
While the analytics are broad in depth and scope, the UI can sometimes lag behind. Reports can leave you scratching your head when the data you need isn’t showing up, because something in the report generation process has gone wrong. Kissmetrics also skews on the high end of entry pricing ($500/month to begin) for this level of analytical tool, which puts smaller businesses at a disadvantage, and causes them to look for free alternatives.
Now that you know what options are available, you need to decide what kind of analytical capabilities your organization needs. From usability, to analytic reporting, to predictive tools, identifying your priorities will help you make the best choice. We encourage you to try one or more of these tools, explore their features, and use the data to make smarter decisions about your digital strategy.